https://www.jimbeam.com/bourbons/jim-beam
小麥味和橡木桶味都非常出彩,制作 cocktail 時它們提供了非常濃烈而明確的味道。非常適合制作雞尾酒。純飲時也可以作為簡單直接的飲料。味道的豐富度相對比較弱。
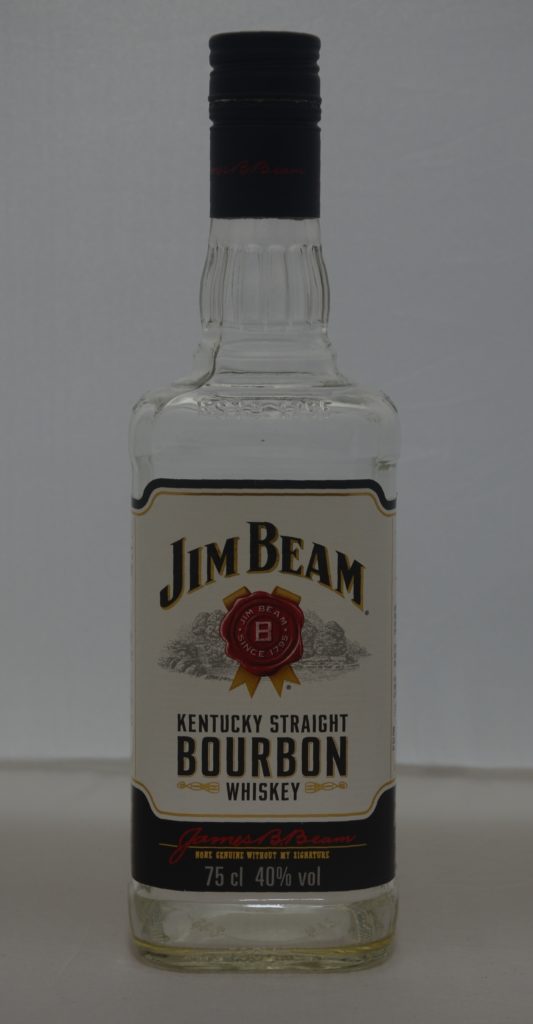
https://www.jimbeam.com/bourbons/jim-beam
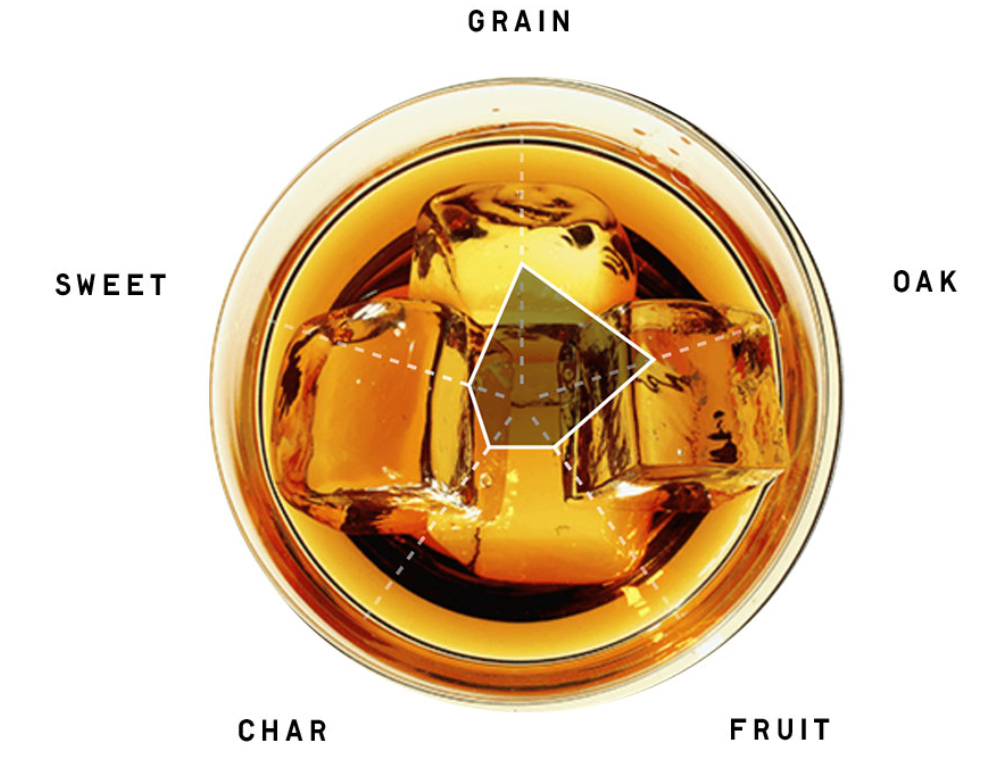
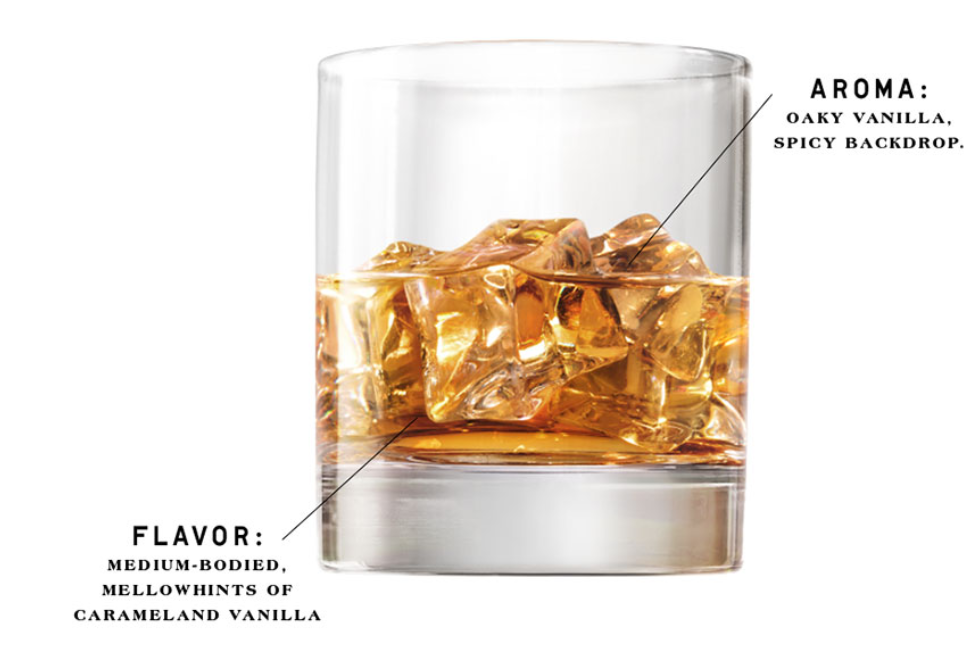
小麥味和橡木桶味都非常出彩,制作 cocktail 時它們提供了非常濃烈而明確的味道。非常適合制作雞尾酒。純飲時也可以作為簡單直接的飲料。味道的豐富度相對比較弱。
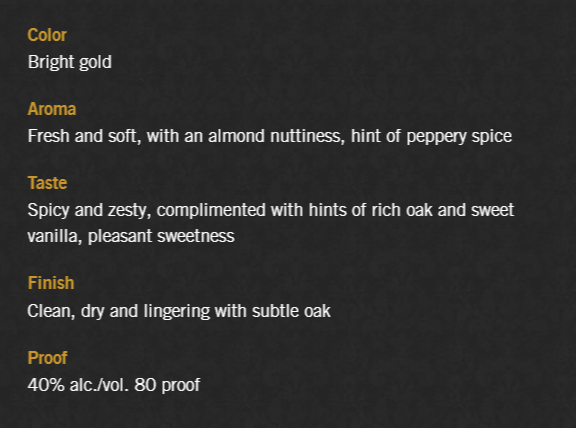
與威雀無年份類似,Canadian Club 無年份同樣也是一款“不烈”的酒。威雀無年份的“不烈”體現在用香和淡來取悅飲者,而 Canadian Club 無年份則單純的降低味道的強度。可以感受到 Canadian Club 無年份是一款複雜的酒,但是各種味道非常淡,很難去捕捉和感受。這樣的設置一方面不適合純飲,另一方面因為 whisky 的味道很淡,在做 cocktail 的時候,也很難扮演好 whisky 作為主演的角色。這支酒更適合作為 whisky 作為輔助的 cocktail,甚至在味道比较重的 cocktail 里面可以直接把它當成 vodka 來用。
官方說明:
https://www.canadianclub.com/us

American Pie
唐·麥克林最著名的創作American Pie常被用來詮釋與形容巴迪·霍利、里奇·瓦倫斯與大波普在1959年2月3日飛機失事而死亡的事件。尤其是“音樂死去的那一天”(The Day the Music Died)這句歌詞最常被廣泛提及[2] 。
月琴
1906年5月22日, 屏東恆春廳大崛尾誕生一位音樂奇才, 最具有鄉土音樂特色的月琴遊唱詩人- 陳達。
由於家境貧窮, 無法接受教育, 但他對音樂充滿濃厚興趣, 11歲時看見大哥與四哥彈奏月琴便著了迷。 兩位哥哥見他廢寢忘食的學習, 深受感動, 便与其他前輩教導他恆春民謠與平埔族歌謠。 19歲那年, 他憑藉著自由曲調, 並結合富有詩意的歌詞, 唱出當地人貧窮生活的點滴故事, 引起很大的迴響與支持, 讓他成了村中最佳的遊唱達人, 於是開始他的表演生涯 。
演藝事業只能圖個溫飽, 可惜造化弄人, 28歲那年 因為腦中風造成 右眼失明、 嘴歪与手腳不靈活 , 也使他終身未能結婚, 境況淒涼。
直到1971年10月, 陳達遇到他生命中的兩位貴人- #史惟亮、与 #許常惠教授, 他們正籌組民歌採集隊, 而恆春陳達是他們的重點項目, 於是出版第一張唱片 《民族樂手- 陳達和他的歌》。 65歲的陳達開始嶄露頭角 。
1976年, 70歲的陳達遭遇人生最困頓時期, 史惟亮教授又安排他參加第一屆民間藝人音樂會, 並在電視与餐廳演唱。 由於他蒼涼的歌聲與詩意的歌詞, 藉由月琴清唱出豐沛的感情, 因而大受歡迎。 這也是他一生最風光的時期。
1978年, 更為林懷民 雲門舞集的《薪傳》伴唱, 隔年又錄製第二張唱片 《陳達與恆春調說唱》。 但晚年的他經濟並未改善, 又為精神病所苦 。
1981年4月11日, 他回到恆春時發生車禍, 不幸去世, 享年75歲 。
……………………………………………………
《綜觀陳達一生的音樂人生, 只有 ‘’感傷‘’ 兩字來形容 !》
半年後, #作家賴西安(#李潼) #感念陳達對音樂的貢獻, #將他的故事寫出歌詞 《月琴》, #由蘇來作曲, #鄭怡演唱, #新格唱片發行。
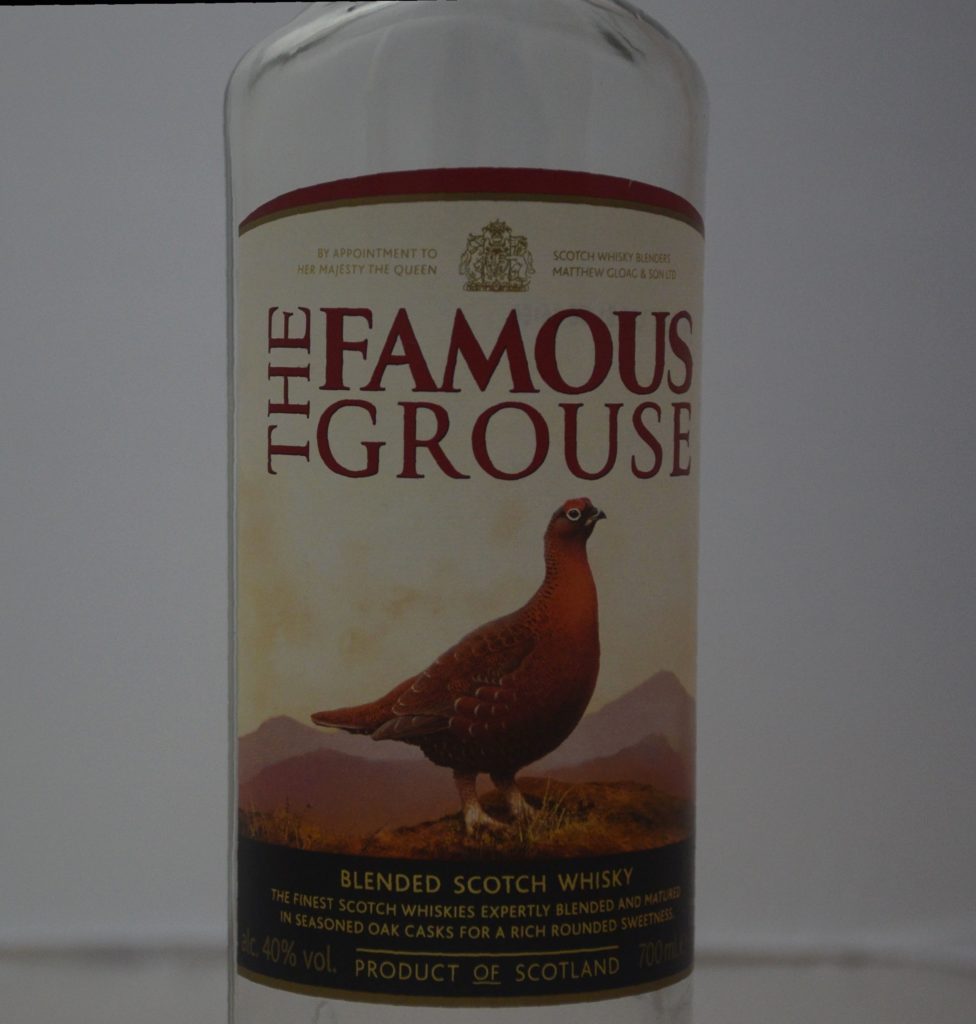
淡淡的味道,偏甜的口感。第一感覺是易入口。當你把它作為品酒的對象想去捕捉的時候,會覺得失望。各種淡味道似乎都在對你諂媚。這些淡卻不單一的味道會讓你覺得也許不那麼簡單。用品酒的心去喝它,終究會打消掉這層疑惑,感到失望。但在疲憊需要一支酒的時候,純飲這支酒常常會是自己下意識的選擇之一。 調酒師(Bar Tender)“第六话:酒杯里的故事 ”裡面它也扮演了類似的角色。
官方說明 :
Appearance
Full, Golden, Clear and bright
Aroma
Well balanced oak, Sherry with a hint of citrus
Taste
Medium full flavour, Mature, Speyside frutiness
Finish
Good length, Clean, Medium dry
1, 在法古文理学院综合餐厅正聊着天,忽然无人声版的《成都》从广播里放出来,内心一下子就跪了。部分同感到垓下之围江东子弟听楚歌的状态。2,第一次和法师喝茶(铁观音和本地红茶。铁观音从第一泡到第十泡的变化及其复杂和有趣。甚至最后几泡都是值得玩味的。(有一种也许可以称为“枯”的 wabisabi 的感觉)红茶虽然没有很厚、很复杂,但是前几泡热烈的果香和茶香让人觉得好开心),第一次和法师在没有把对方当做出家人/非出家人的状态下轻松的聊茶聊生活。也是第一次觉得和法师能变成好朋友。喝完茶回忆起和尹航做室友时天天喝茶喝酒的愉快生活,好久了呢。什么时候能再喝一杯呢。3,目击低低卧在山顶的安静充满力量的黄色老人星,老人星成就达成。(浪漫追星社有关于老人星的剧情:P) 4,夜里十一点倚在在金宝山墓园墙边和邓丽君聊天成就达成。5,夜里十点在基督教墓园散步成就达成。作为术士(warlock)角色的重度爱好者,真的把魔兽世界虚拟转化为现实时,有好多相似的感觉,也有好多不一样的(嗅觉、触觉、身体的状态带来的感受)。5,近凌晨时跟着 Google Map 往朱明美术馆走,选到一条山间充满杂草、沼泽,只有月光照明的无名小路。开着手机灯摸黑前行,在离朱明美食馆步行十几分钟的丛林里成功的两脚踏入一片泥潭。陷入泥潭成就达成。真实感受到泥潭中泥是如何把人吸下去。也实践了从泥潭里面爬出来的正确方法。

var a = ‘aaaaa\r\nbbbbbb’;
console.log(JSON.stringify(a));
console.log(a);
From: https://segmentfault.com/q/1010000011005586